.svg)
Solutions
Features
Resources
Trusted by 2,000+ operators
"Whether you have a smaller listing count or a larger one, Uplisting is easy to use, and it's scalable."
Josh Kristoff
Nomad Capital Adventures

4.8/5

4.9/5
Log in to your account
"Whether you have a smaller listing count or a larger one, Uplisting is easy to use, and it's scalable."
Josh Kristoff
Nomad Capital Adventures
Log in to your account
.png)
Want the highlights in a format you can save, share, or include in your own vacation rental owner reporting?
It’s an easy reference guide with key data on occupancy, pricing, guest trends, and pacing—perfect for benchmarking your performance or sharing with stakeholders.
Summer 2025 was a strong one for UK short-term rentals. Airbnb data for the UK shows that occupancy climbed to one of the highest levels in years, nightly rates held firm, and demand kept pace with record supply.
This report brings together the latest short-term let data in the UK with exclusive insights from Uplisting subscribers. Unlike other short-term rental reports that stop at averages, we look at how real operators are performing on the ground across occupancy, pricing, guest mix, booking channels, and reviews.
Inside, you’ll find:
This vacation rental market report is a practical snapshot of where the market stands, where it’s heading, and how property managers can use the data to stay competitive.
The first part of this report looks back at how the UK short-term rental market performed in summer 2025 and what drove one of the strongest summer seasons in recent years. These retrospective trends also set the foundation for interpreting the forward-looking pacing information later in the report.
Summer 2025 was a strong season for vacation rental managers in the United Kingdom. Occupancy for entire-home listings averaged 73.8%, up from 71.9% in 2024. That lift was driven by both a 5% increase in nights sold and a 3.8% increase in supply, according to AirDNA.
When you look at Airbnb occupancy rate data for the UK over the past eight years, summer 2025 ranks as the third-best season since 2018. Here’s how occupancy has stacked up when you average it across short-term rental booking platforms:
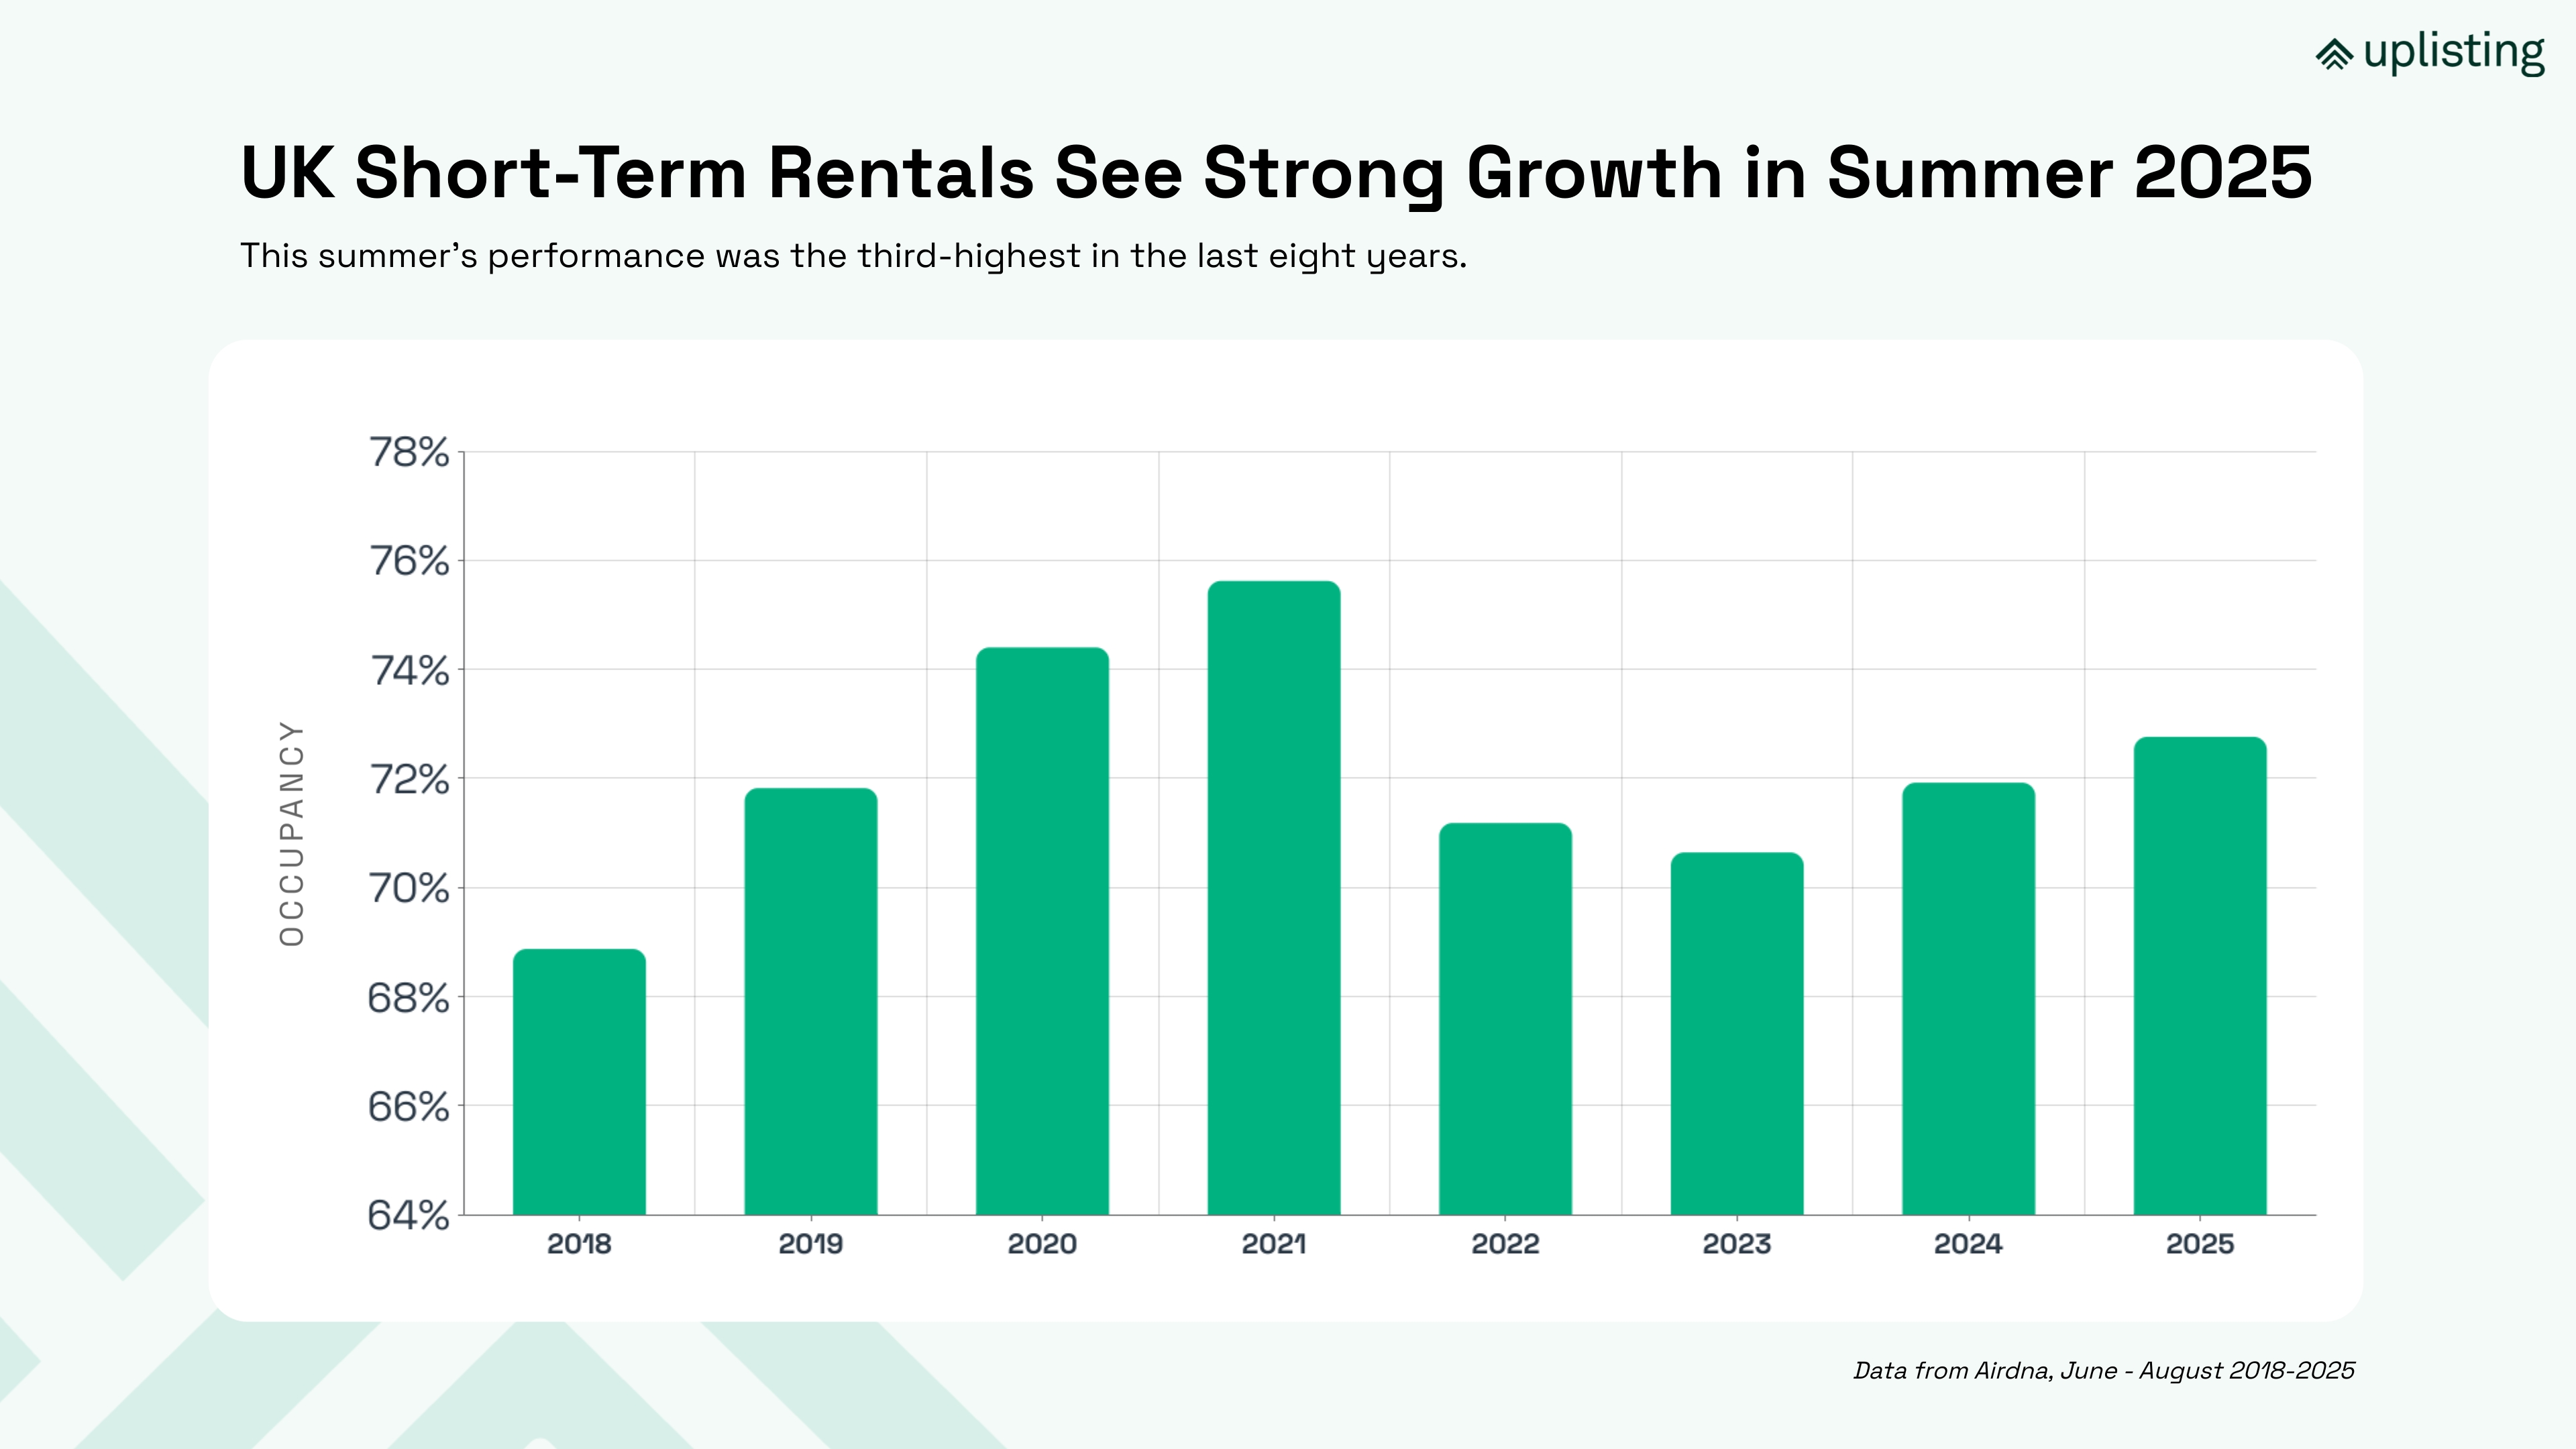
The market’s resilience becomes even clearer when viewed alongside supply growth. The number of available listings has climbed from 187,415 in 2018 to 334,941 in 2025. That’s an increase of nearly 80% in eight years. Even with that rapid expansion, demand has largely kept pace, allowing occupancy to remain high.
Occupancy growth under a system with expanding inventory has limits, however. The balance between more listings coming online and steady traveler demand is starting to show in the forward-looking data. As we’ll see later in this report, demand pacing for the remainder of 2025 is higher than last year, yet occupancy pacing is trending lower. Supply growth is outstripping demand growth, which is beginning to weigh on occupancy rates.
Rates remained strong through the summer. The average daily rate (ADR) hit £210, which was 4.2% higher than summer 2024. Combined with higher occupancy, this pushed RevPAR (revenue per available rental) up 5.4% year-over-year.
This pricing resilience is critical for operators. Even with more competition, hosts who held firm on nightly rates saw healthier returns compared to those chasing volume.
Travelers from the UK continue to dominate the market, making up 61.9% of all guests this summer. That’s a slight increase from 61.7% in 2024, showing domestic demand remains the backbone of the sector.
Among international travelers, shifts were modest but notable:
These share changes don’t necessarily reflect fewer or more travelers in absolute terms. Rather, they show how the composition of international demand is evolving. Domestic travel is holding strong, while some key inbound markets, like the U.S. and France, are losing relative ground.
.jpg)
Alongside comprehensive Airbnb properties data for the UK, we also looked at how Uplisting subscribers performed compared to the broader market. This perspective highlights where professional operators are outperforming, particularly in how they manage booking channels and maintain guest satisfaction at scale.
While Airbnb remains the dominant booking channel across the UK market, Uplisting hosts are starting to see a shifting landscape. The share of nights booked through Airbnb dropped from 46.7% in 2024 to 42.3% in 2025.
Where did that demand go? Much of it shifted to direct bookings, which climbed from 21.9% last summer to 25.4% in 2025. That’s a meaningful change.
Direct bookings typically mean lower commission costs, more control over the guest experience, and stronger repeat guest potential. For Uplisting subscribers, the shift toward direct reservations is a sign of stronger brand-building and smarter channel management.
Booking.com held steady at 31.5%, while Vrbo remained a small player at 0.7%. In summary, while the wider market is becoming more reliant on OTAs, Uplisting users are carving out a healthier mix with a growing share of direct demand.
.jpg)
Guest satisfaction remained high across Airbnb listings in the UK over the summer. The average review score was 4.83 in summer 2025, slightly higher than last year. In fact, 89.2% of all reviews were 5-star ratings.
When you break down review scores by portfolio size, the challenges of scale become clear. As your vacation rental management portfolio becomes larger, your average overall rating takes a hit. While single-unit hosts average a 4.86 overall rating, that score takes a precipitous drop once you hit 6 or more units (4.73). Hosts with 100 units or more have an average overall rating of 4.69.
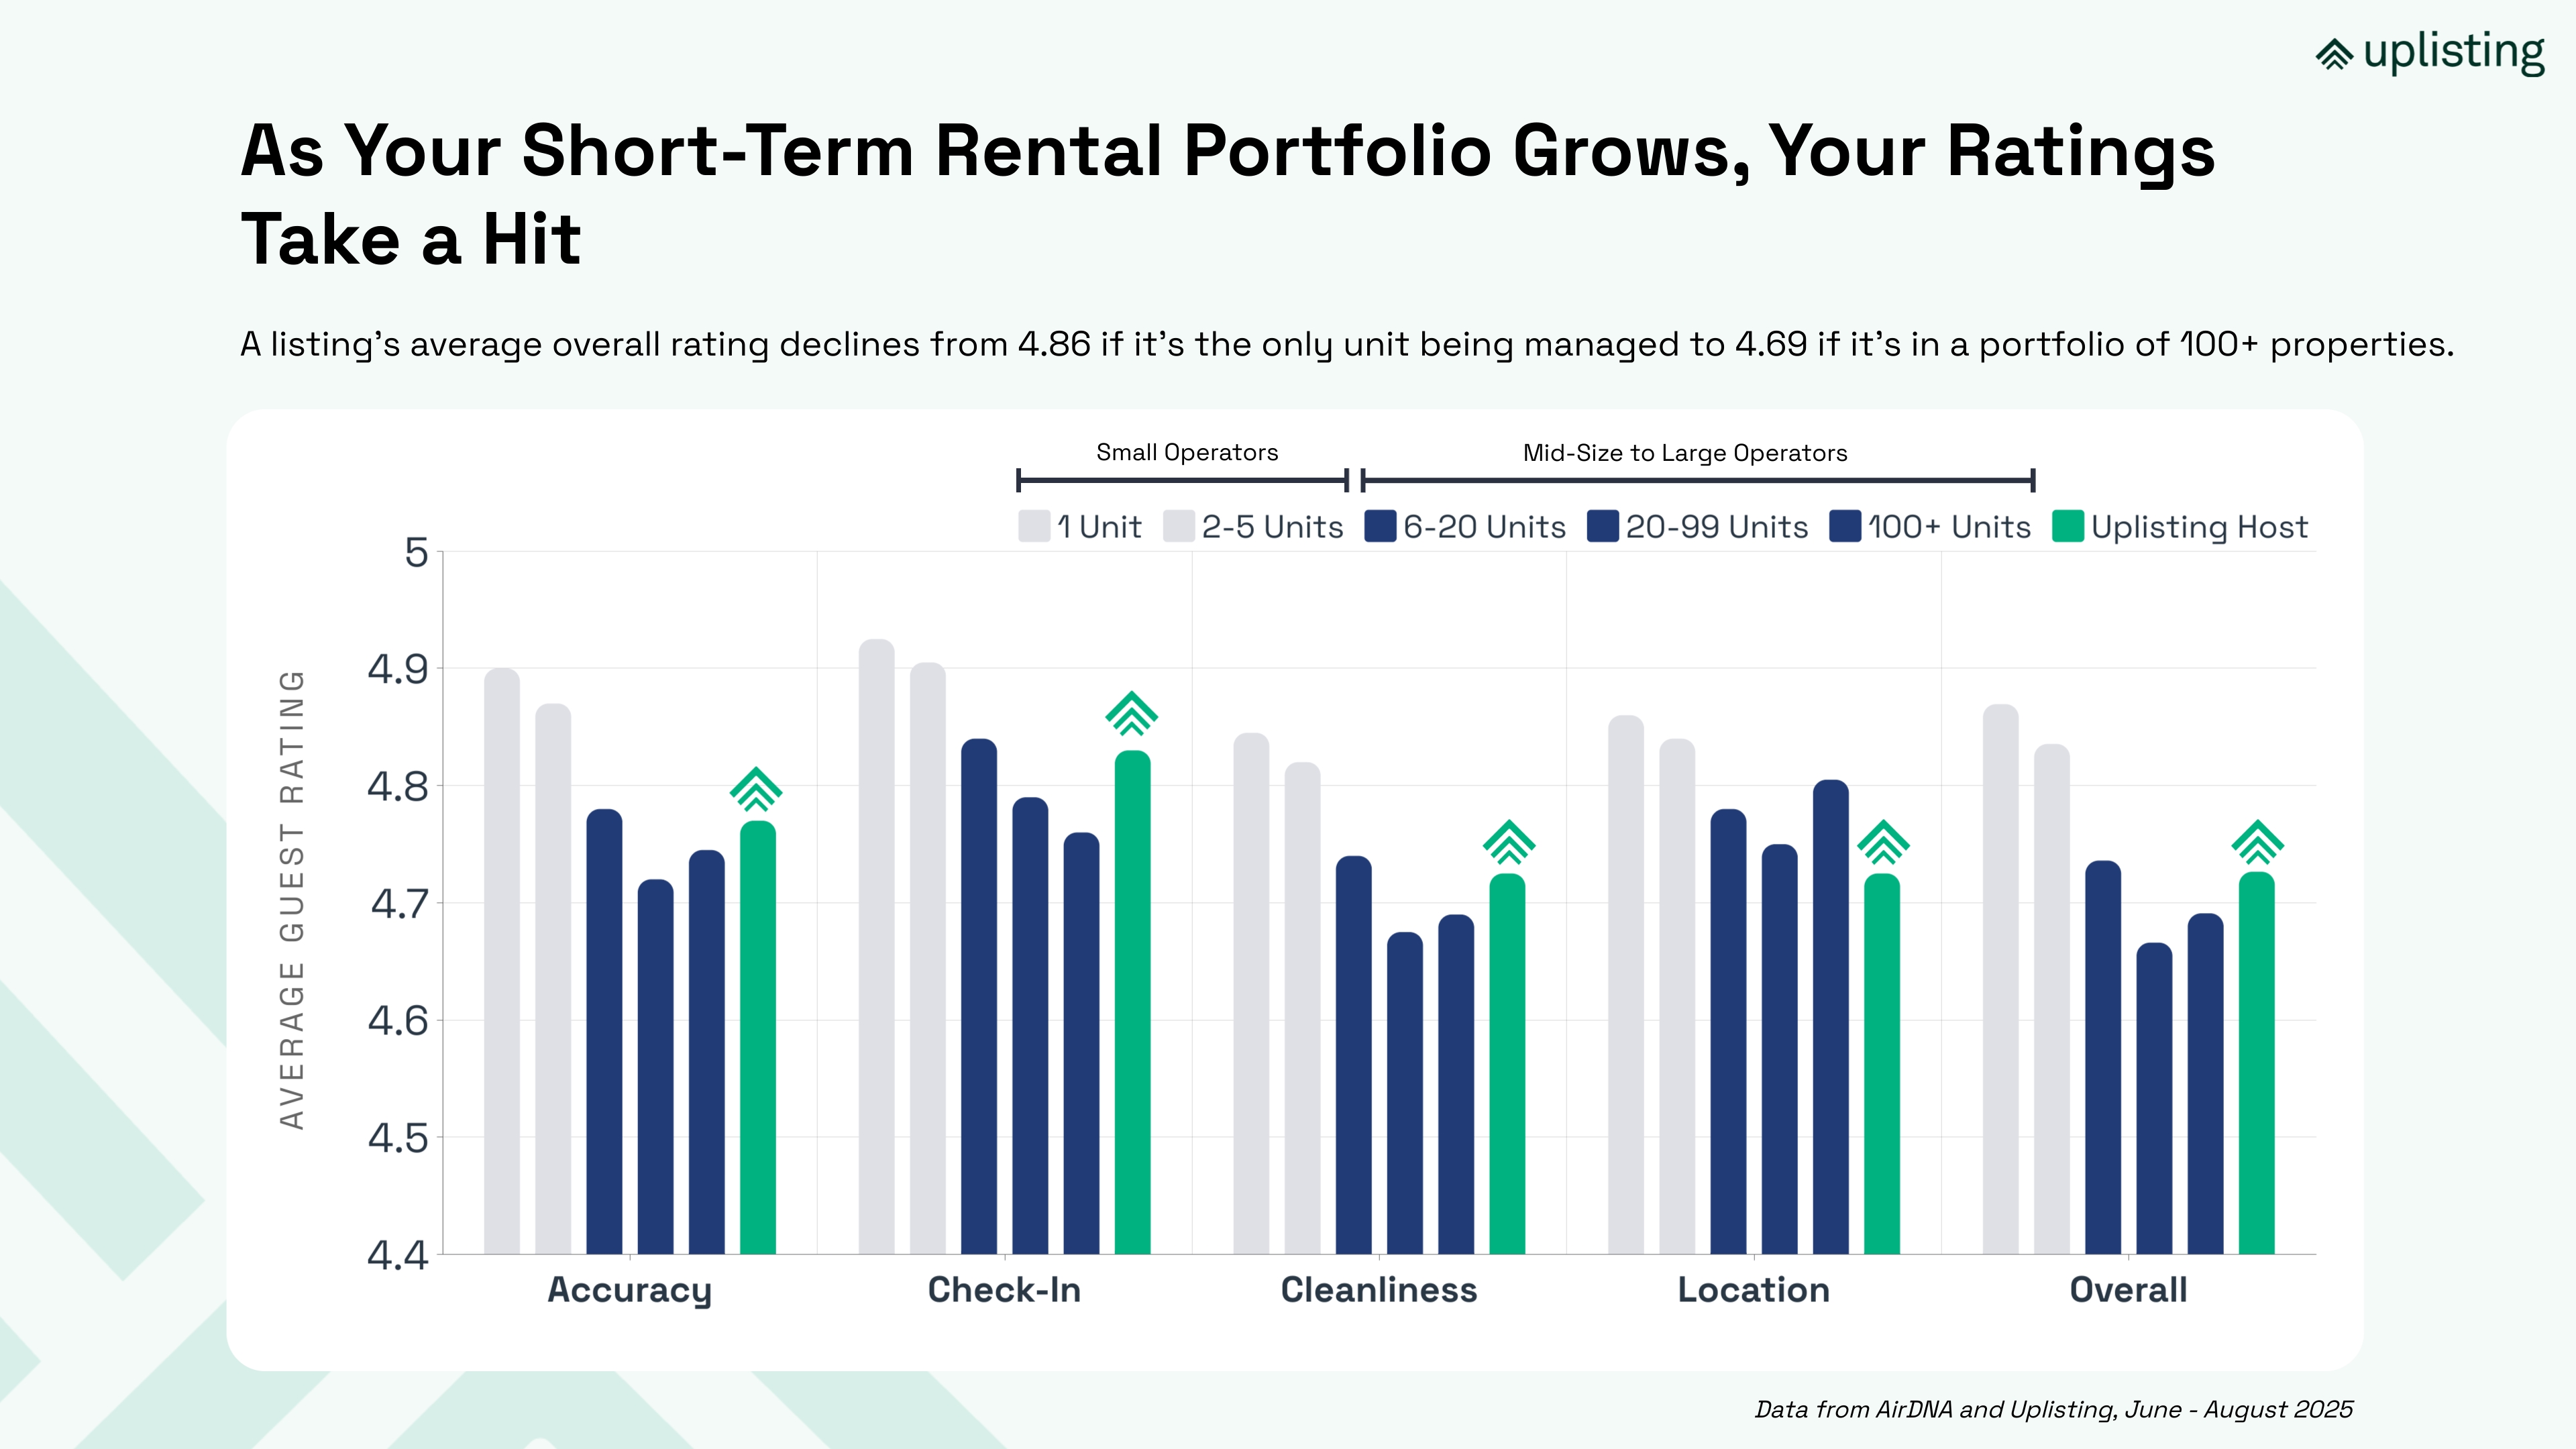
At first glance, differences like 4.86 vs. 4.69 may seem trivial. On Airbnb, however, even a tenth of a point matters. These small shifts can decide whether a host qualifies for Superhost status, earns the Guest Favorites badge, or risks slipping in Airbnb’s search rankings. Badges and high ratings directly impact visibility, guest trust, and booking conversion—which means they have a measurable effect on revenue.
That’s especially true in categories like Communication and Value, which guests weigh heavily in reviews. The data shows that these categories are the hardest to maintain as you scale:
Here’s where Uplisting subscribers stand out. Uplisting hosts scored an average of 4.86 for Communication and 4.66 for Value on average. This is regardless of portfolio size, meaning they outperform most mid-sized and large operators.
For guests, that difference is tangible. For managers, it reinforces the value of automation, streamlined messaging, and operational consistency. These are tools that make it possible to scale without sacrificing guest experience.

Want the highlights in a format you can save, share, or include in your own vacation rental owner reporting? It’s an easy reference guide with key data on occupancy, pricing, guest trends, and pacing—perfect for benchmarking your performance or sharing with stakeholders.
After reviewing the summer retrospective, we now turn to the forward-looking Airbnb performance data for the remainder of 2025. This pacing outlook tracks how bookings are shaping up for October through December, giving managers an early view of demand, occupancy, and revenue trends as supply continues to expand.
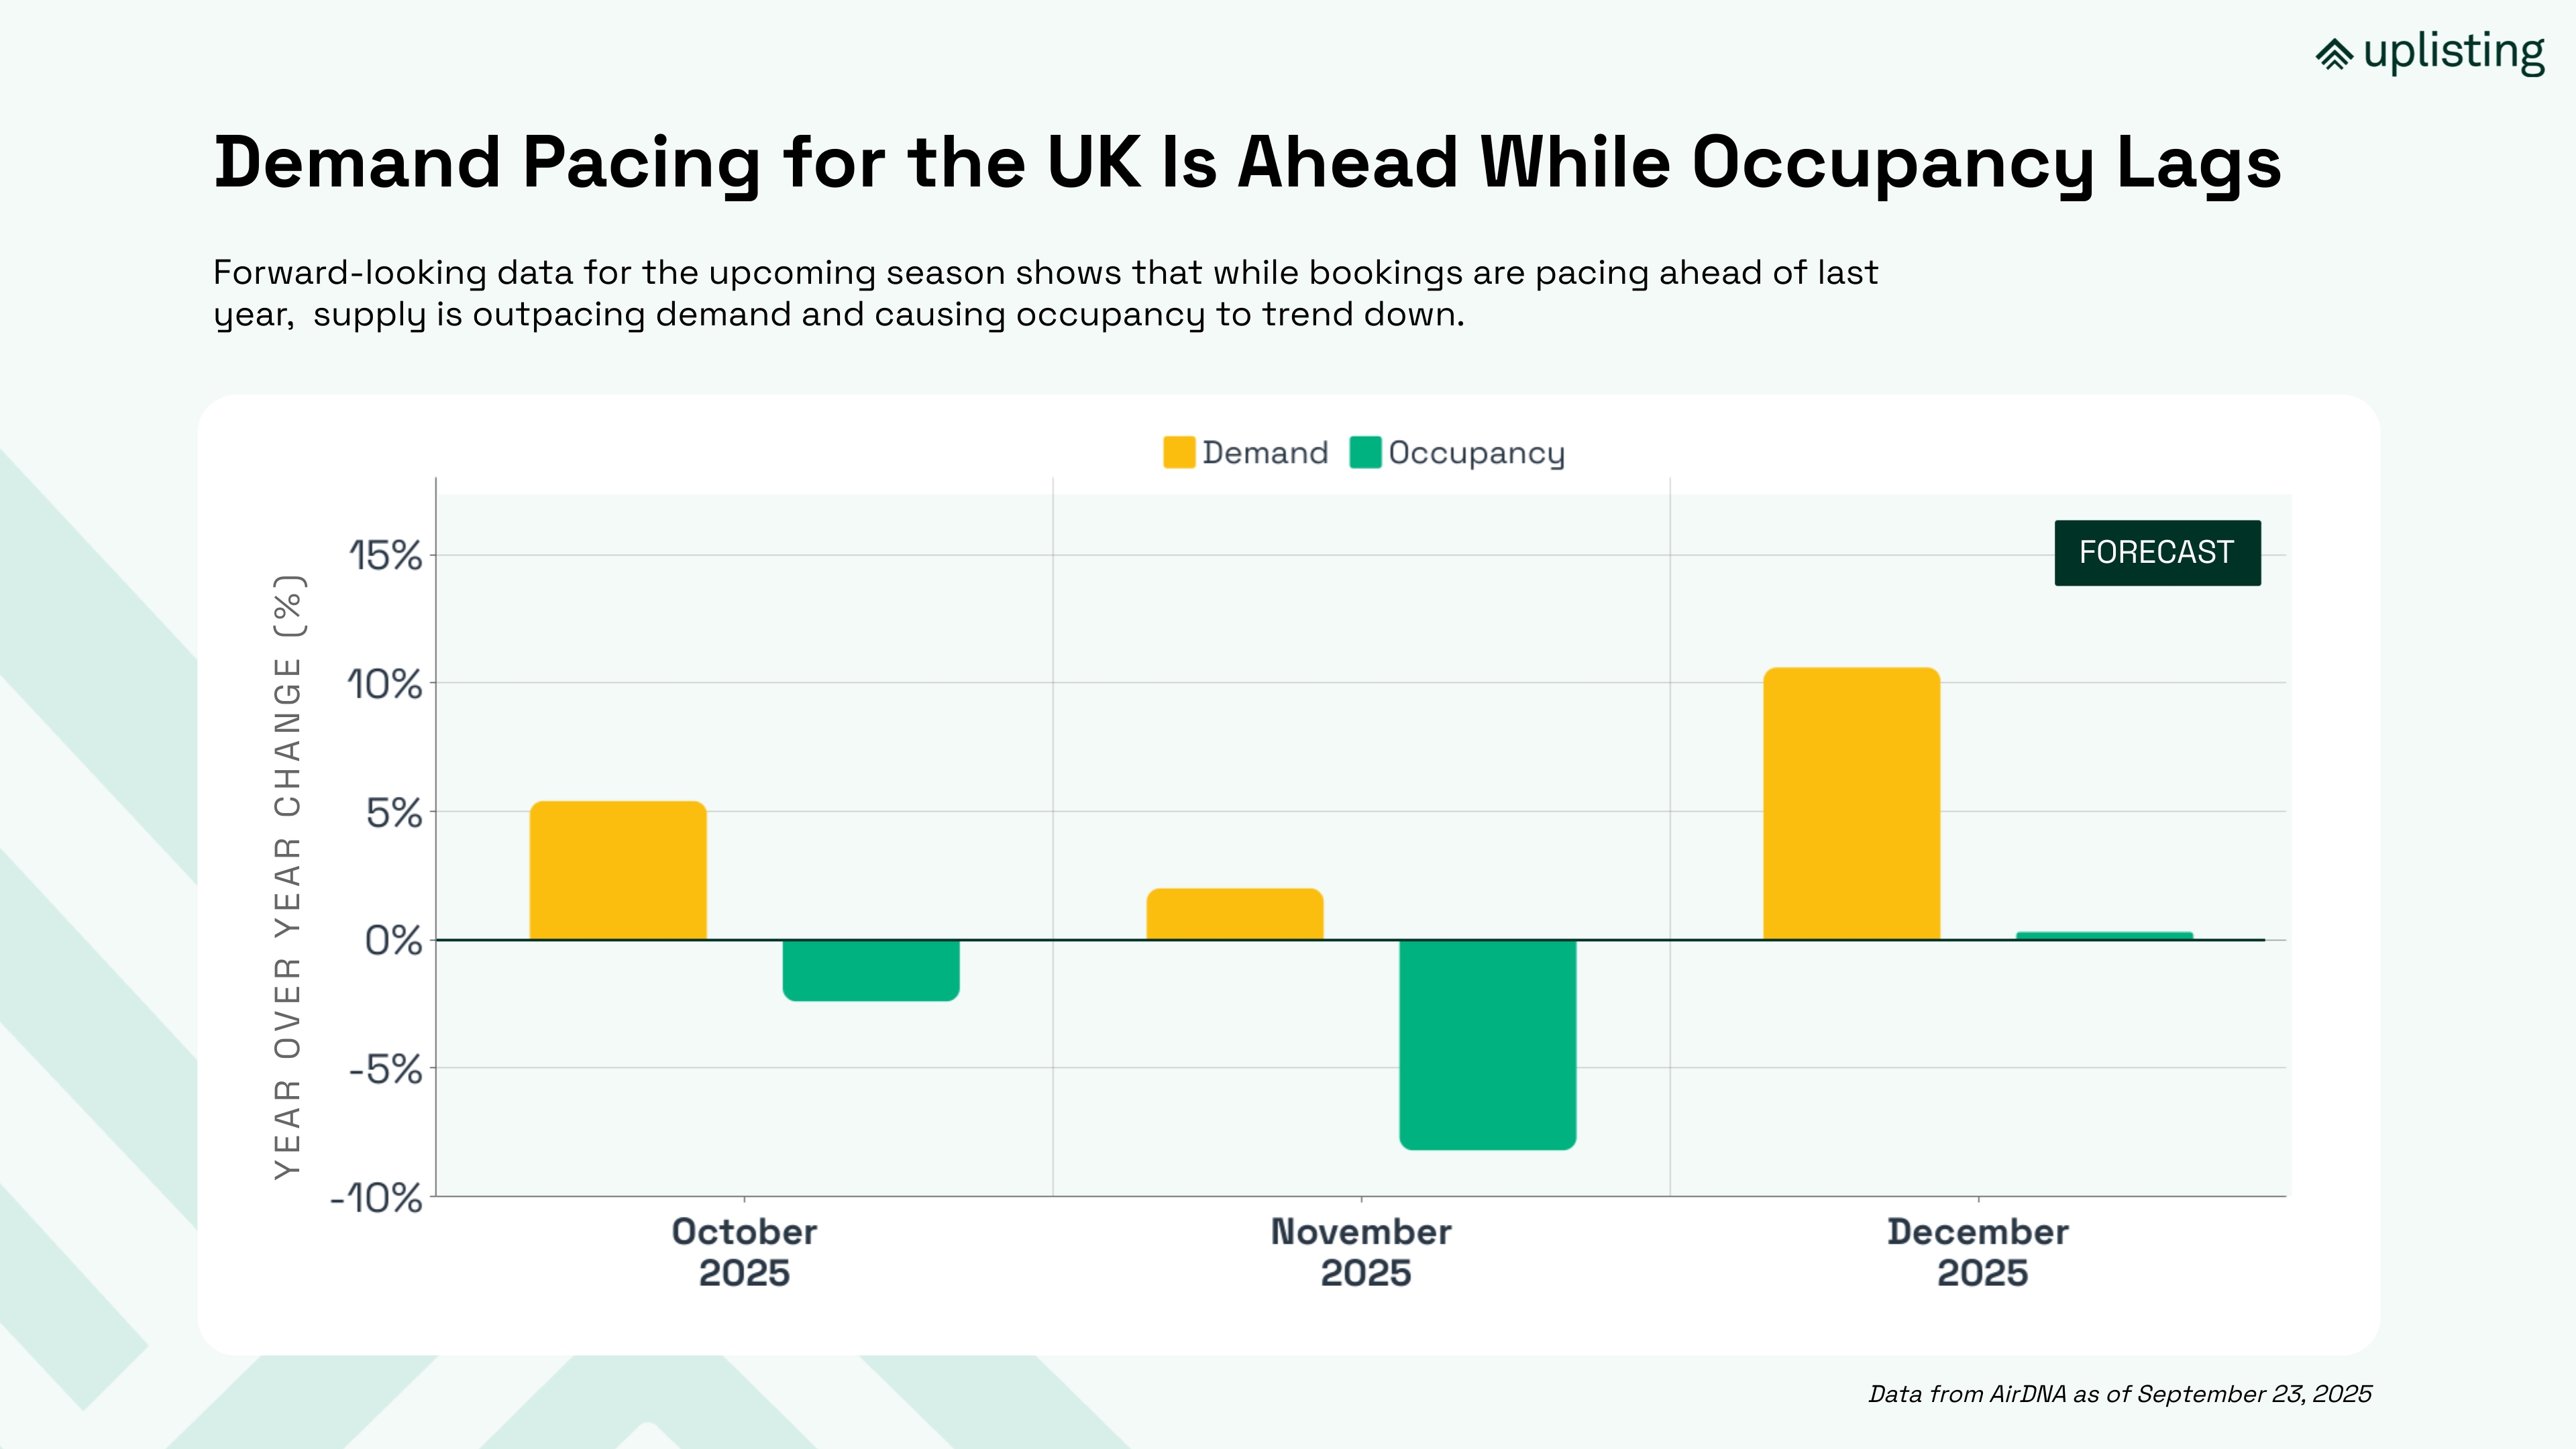
Looking ahead, demand for short-term rentals in the UK is trending higher than 2024. However, occupancy tells a different story. Supply is growing even faster than demand, which is pushing occupancy rates down.
Compared year-over-year, all three months are pacing behind 2024. The exception is December, which is roughly flat. This dynamic illustrates the supply-demand imbalance we noted earlier: demand may be up, but with more listings on the market, hosts will need to compete harder for bookings.
Occupancy pacing isn’t affecting all property types equally. Budget and economy listings are carrying the heaviest declines, while midscale, upscale, and luxury are proving more resilient. We define price tiers in 20% increments, meaning that the top 20% of listings by nightly rate in any given market are considered luxury, while the bottom 20% by price are considered budget.
The average year-over-year change in occupancy through the end of the year varies by price tier:
Occupancy pacing varies by month as well. Across price tiers, November is forecasted to see the largest dip in occupancy compared to 2024 numbers. That dip ranges from -11.2% year-over-year (YOY) for budget-tier properties to -5.1% YOY for luxury vacation rentals.
December occupancy is pacing positively YOY for all price tiers except for budget properties, which will see a modest -1.5% decline compared to 2024. Midscale properties are pacing to improve on 2024’s occupancy by 4.1%.

Despite weaker occupancy, RevPAR pacing is positive across all tiers. Budget properties, for example, are projected to earn 6% higher RevPAR on average through year-end, thanks to stronger pricing power. RevPAR is pacing:
This highlights an important point: even when occupancy softens, ADR growth can offset losses if managers hold firm on their rates.
Performance also varies by location. Some markets are showing early signs of contraction, while others are set to outperform.
Most markets are set to experience positive year–over-year growth in demand nights, with the exception of:
In these markets, growing supply is compounded by traveler demand softening. Managers here will need to be proactive in attracting bookings:

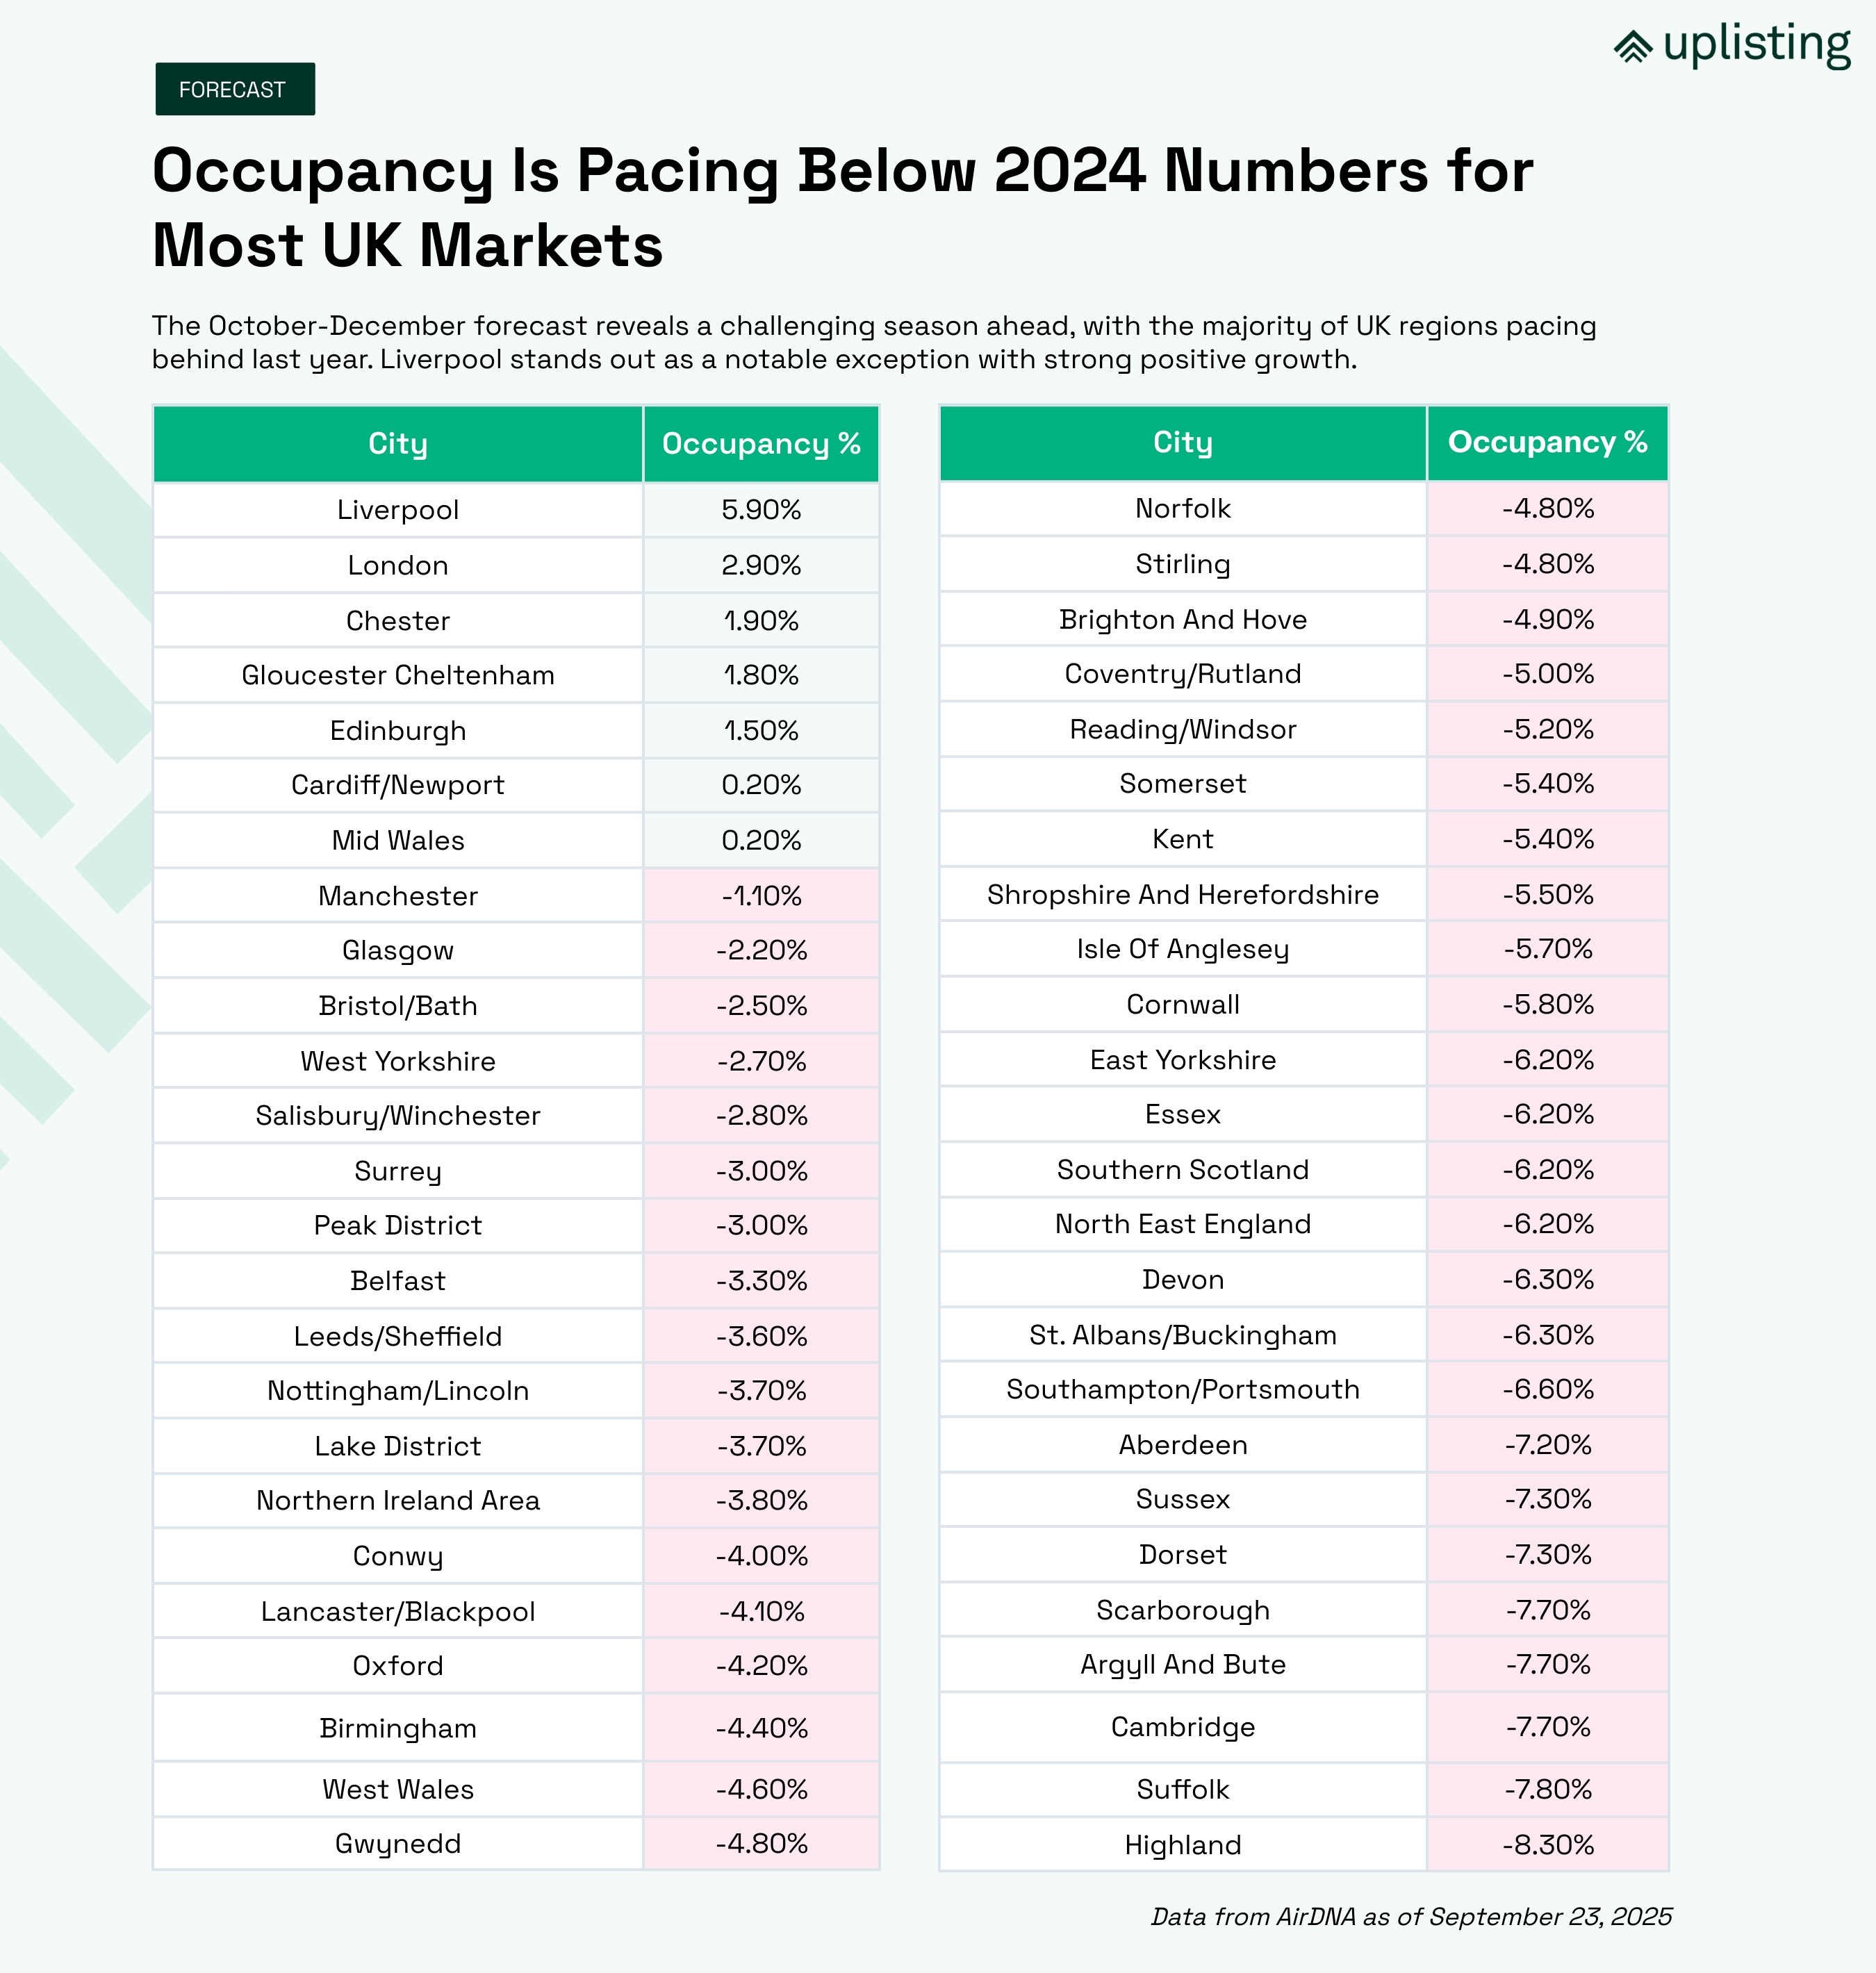
On the other end of the spectrum, occupancy is pacing negatively year-over-year for the majority of UK markets, with the exception of:
These are the over-performing markets relative to the market average. Managers in these regions have an opportunity to:
This split is important: in some UK regions, managers are fighting for every booking, while in others, the challenge is maximizing returns in a stronger-than-average demand environment. These dynamics set the stage for the next section on what all of this data means for vacation rental managers across the UK as we head into the fall.
The UK short-term rental market delivered a healthy summer in 2025. Occupancy climbed to one of its highest levels in the past seven years, rates held strong, and RevPAR grew despite a surge in available listings. That resilience shows that demand for short-term rentals is still robust, even as competition intensifies.
The pacing data for autumn and winter reinforces a reality that’s been shaping the market for several years: supply growth continues to outpace demand growth. This means operators can’t rely on occupancy gains alone. You may be selling more nights than ever before, yet still see occupancy percentages soften because there are simply more properties on the market.
Looking at both the summer retrospective and the forward-looking outlook together, three clear themes stand out for managers:
This isn’t new, but it’s ongoing. Occupancy percentages may stay flat or dip even in strong demand years. The key is to benchmark your own performance against both demand growth and supply growth in your market, not just occupancy in isolation.
Summer ADR increases lifted RevPAR, and pacing data shows RevPAR growth continuing into winter. This is true even in markets where occupancy is under pressure. Strong rate discipline has been, and will remain, a manager’s best lever in a crowded market. Keep in mind that the degree of pricing power depends on where your properties sit in the market. Budget and economy operators can lean harder on rate growth than luxury hosts with higher price points.
Reviews show that communication and value scores slip as operators scale, but Uplisting subscribers buck that trend. Combined with rising direct booking share, these strengths help PMS-connected hosts maintain profitability and reduce OTA reliance. These are advantages that compound over time.
Taken together, the data points to a clear strategy:
The market is healthy, but it’s also crowded. Managers who understand the ongoing interplay between demand, supply, occupancy, and guest experience will be best positioned to finish 2025 strong and carry momentum into 2026.
This report combines market-wide data from AirDNA with subscriber performance data from Uplisting. Together, these sources provide both the breadth of the UK market and the depth of real operator results.
If you’re interested in more nuanced data on guest reviews, this data is available for all hosts through AirDNA’s property manager tool for comparison across the market or against specific property managers.
This report shows that UK occupancy averaged 73.8% in Summer 2025, one of the highest levels in the past eight years. Occupancy is also tracked on a forward-looking basis through pacing data, which reveals that while demand is trending higher year-over-year for autumn and winter in 2025, rapid supply growth is keeping occupancy percentages under pressure.
As of summer 2025, the UK had more than 334,000 active short-term rental listings, up nearly 80% since 2018. The growth seen in the Airbnb properties data for the UK is a key reason why occupancy percentages don’t always rise even when demand increases. There are simply more rentals competing for bookings.
Vacation rental analytics and reporting allow managers to benchmark performance, spot demand shifts, and adjust strategy. For example, pacing data can help operators identify whether they should hold firm on pricing or adjust to stimulate demand. Meanwhile, vacation rental owner reporting from tools like Uplisting makes it easier to track direct bookings, guest reviews, and revenue performance. These are all critical metrics for staying competitive in a crowded market and are key data points to share with owners if you’re managing their properties.
.png)